Custom Report
Custom Report
In our Setting up guide you set up your development environment and created a new plugin. In this guide, we'll make that plugin show a custom report.
Did you know? You can create new custom reports in only seconds without any developer knowledge with the Custom Reports premium feature.
Adding a new report
We're going to create a new report that shows the browsers used for the most recent visits. We'll be using data returned by the Live! plugin so we won't have to do much processing ourselves.
On reports and metrics
Reports and metrics are the two types of analytics data Matomo calculates and stores:
- metrics are just single values, like visits
- reports are two-dimensional arrays of values, usually metric values, and are stored using the DataTable class.
Additionally, each row of a report can link to another DataTable. These linked DataTables are called subtables.
To add a new report you should use the CLI tool and execute the following command:
$ ./console generate:report
This command will guide you through the creation of a report and ask for several things such as the name of your plugin and the name of the report you want to create. When it asks you for a report name, enter "Last Visits By Browser", choose the category "Visitors" by moving the arrow keys up or down and leave the dimension empty.
Adding a menu item
The CLI tool has created a new file Reports/GetLastVisitsByBrowser.php within your plugin folder. We recommend taking the time to have a look at all the methods and comments to get an idea how a report is defined.
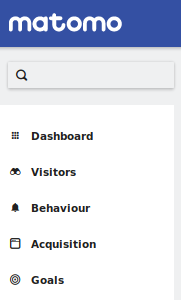
Links to Matomo's reporting pages are displayed on the main page under the logo:
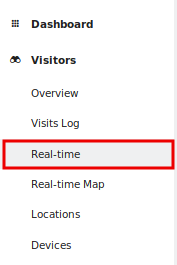
Making your report visible in the menu is as easy as opening the report class and defining a menu title in the init() method:
$this->subcategoryId = 'Real-time Reports';
Sometimes the title of the menu item is the same as the report name. In this case you can simplify the menu title definition as follows:
$this->subcategoryId = $this->name;
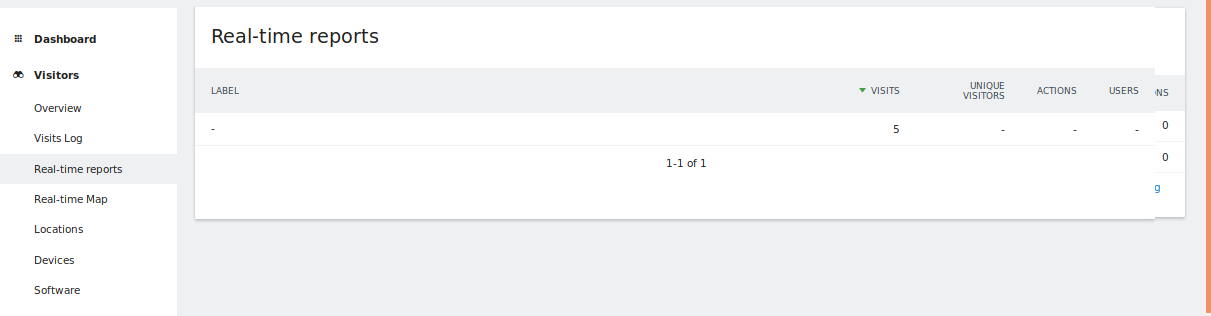
If you click on it, the page will be loaded below the period selector:
Making it a widget
A widget allows users to add your report to the dashboard. It also lets them embed the report on other websites, for example using an iframe.
Making a widget is quite easy. Only define this configureWidgets method in the report class and you are done.
public function configureWidgets(WidgetsList $widgetsList, ReportWidgetFactory $factory)
{
    // we have to do it manually since it's only done automatically if a subcategoryId is specified,
    // we do not set a subcategoryId since this report is not supposed to be shown in the UI
    $widgetsList->addWidgetConfig($factory->createWidget());
}
Changing the widget name
By default the widget name will be the same as the report name. If you want to have a different widget name you can define a name as follows:
public function configureWidgets(WidgetsList $widgetsList, ReportWidgetFactory $factory)
{
    $widget = $factory->createWidget()->setName('Live_RealTimeVisitorCount');
    $widgetsList->addWidgetConfig($widget);
}
Creating multiple widgets from one report
You can create as many widgets from one report as you want. In Matomo there are several reports that actually create 3 or even more widgets out of one report. For example one widget with a default visualization that lets the user change the visualization, one widget with an "Evolution" visualization and one widget with a set of "Sparklines" visualization.
public function configureWidgets(WidgetsList $widgetsList, ReportWidgetFactory $factory)
{
    // in this case it will render the configured default visualization
    $widgetsList->addWidgetConfig($factory->createWidget());

    $widgetsList->addWidgetConfig(
        $factory->createWidget()
            ->setName('Simple tag cloud')
            ->setSubcategoryId('Tag clouds')
            ->forceViewDataTable(Cloud::ID)
            ->setOrder(5)
    );
}
Adding an API method
Reports and metrics are served by API class methods.
The report generator automatically creates this method for you so you just have to fill it. In your plugin's API class (stored in API.php), look for the following method:
public function getLastVisitsByBrowser($idSite, $period, $date, $segment = false)
{
    ...
}
API parameters
Every API method that serves a report or a metric will have the parameters listed above. This is because all analytics data describes log data that is tracked for a certain website and during a certain period. A segment can be provided to further reduce the data that is analyzed, but it's optional (which is why the parameter defaults to false).
The website is determined by the $idSite parameter and the period by both the $period and $date parameters. The segment is determined by the value in the $segment parameter.
You can see the output of this method if you visit this URL: http://localhost/index.php?module=API&method=MyPlugin.getLastVisitsByBrowser&idSite=1&date=today&period=week.
Well, our simple custom report is almost done, now it is time to develop the API method that returns the report data! Learn about building an API method in the next guide, or read our extended custom reports guide.