Report visualizations
Report visualizations
In Matomo (formerly Piwik), an analytics report is just a set of two-dimensional data, stored as DataTable objects and returned by API methods.
Controllers can display these reports using the ViewDataTable class: this is called a report visualization.
Report visualizations can be in any format. For example, the sparkline visualization outputs an image. However, most visualizations will output an HTML widget that allows users to switch between different visualizations.
Report visualizations
A report visualization is a class extending ViewDataTable.
Every visualization has a unique ID that is specified by a class constant named ID. They are referred to by this ID, not their class name, because they must be able to be specified in the viewDataTable query parameter. Using a fully qualified class name would be too verbose.
The viewDataTable query parameter is set by ViewDataTable's associated JavaScript code. It represents the user's choice of view (made by clicking on a visualization's footer icon) and thus will override any visualization type specified in code.
Users can switch visualizations by clicking on one of the icons displayed below the visualization itself:
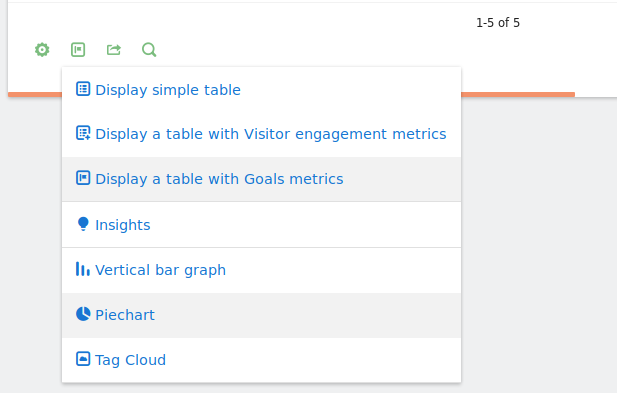
These icons are called footer icons. Not all visualizations have to be available in this manner. For example, the Visit Log uses its own visualization, but since it can only use data from one report (Live.getLastVisitsDetails) it is not available in the footer of other reports.
To learn more about the controls that surround a visualization in most report displays, read the user documentation for report visualizations.
Using ViewDataTable
There are two ways to output a visualization for a report in a controller.
The most succinct way is to call the Controller::renderReport() method:
class Controller
{
    public function myReport()
    {
        return $this->renderReport(__FUNCTION__);
    }
}
This method will create a new ViewDataTable instance and render it. The report can be configured via the ViewDataTable.configure event (read more about Events).
The other way is to manually create and configure a ViewDataTable instance:
class Controller
{
    public function myReport()
    {
        $view = \Piwik\ViewDataTable\Factory::build(
            $defaultType = 'table', // the visualization type
            $apiAction = 'MyPlugin.myReport',
            $controllerMethod = 'MyPlugin.myReport',
        );
        $view->config->show_limit_control = false;
        $view->config->show_search = false;
        $view->config->show_goals = true;

        // ... do some more configuration ...

        return $view->render();
    }
}
ViewDataTable::render() will retrieve the report by calling the reporting API and return HTML to be displayed.
Note: The report visualization will refresh itself using AJAX, which means there must be a controller method for each report (as shown in the example above). You can use ViewDataTable outside of a controller method, but it must still reference a controller method.
Configuring ViewDataTable
ViewDataTable instances are configured by setting properties of:
$view->config(Configobject): how the report is displayed$view->requestConfig(RequestConfigobject): how the data is obtained and, in part, what is displayed
Displaying reports on a page
Once a controller method for a report exist, displaying it on a page is straightforward:
class Controller
{
    // Page
    public function index()
    {
        $view = new View("@MyPlugin/index.twig");
        // Generate the report visualization to use it in the view
        $view->myReport = $this->myReport();
        return $view->render();
    }

    // Report method
    public function myReport()
    {
        return $this->renderReport(__FUNCTION__);
    }
}
The index.twig template will look like this:
<h1>My Report</h1>

{{ myReport }}
Displaying reports in the Dashboard
A report can be made available to the dashboard by defining a widget. The recommended approach is to configure widgets in your report's configureWidgets() method using WidgetConfig objects:
class GetMyReport extends \Piwik\Plugin\Report
{
    protected function configureWidgets(WidgetsList $widgetsList, ReportWidgetFactory $factory)
    {
        $widget = $factory->createWidget();
        $widgetsList->addWidgetConfig($widget);
    }
}
Alternatively, you can create a standalone widget class in your plugin's Widgets/ directory.
Matomo users will then be able to see and select myReport in the widget selector.
Note: Any controller method can be embedded in the dashboard, not just reports. So if you have a popup that you'd like to make available as a dashboard widget, you can create a widget class for it. This is exactly how we made the Visitor Profile available in the dashboard.
Core report visualizations
The following is a list of visualizations, called Core Visualizations, that are available by default (listed by their viewDataTable ID):
table: table of rows and columns (the main visualization used to view reports)tableAllColumns: same astablebut includes a couple of extra processed metricstableGoals: same astablebut includes goal metrics and goals of the websitegraphVerticalBar: vertical bar graph (uses jqPlot)graphPie: pie graph (uses jqPlot)graphEvolution: line graph showing the evolution of a set of reports over time (metrics are displayed as different series)cloud: tag cloud of report labels. The font size of each label is proportional to a given metric.sparkline: line graph showing the evolution of one metric over time. Outputs an image as opposed to HTML.
You can use these visualizations when creating ViewDataTable instances without having to install third-party plugins.
Creating new visualizations
Plugins can provide their own visualizations, either for use within the plugin or as a new visualization that can be applied to any report.
The Treemap Visualization plugin is an example of a plugin providing a visualization that can be used for any report.
Extending ViewDataTable
To create a visualization that will not output HTML, then extend directly from ViewDataTable.
To create an HTML visualization, extend from Visualization instead. This base class provides common behavior you see in all core visualizations: show the footer icons, the limit selector, the report documentation, the search box...
ViewDataTable metadata
In your new class, the first thing you want to do is set the necessary visualization metadata using class constants:
ID(required): unique ID which will be set in theviewDataTablequery parameterTEMPLATE_FILE(required): reference to a Twig template file, e.g."@MyPlugin/_myDataTableViz.twig"FOOTER_ICON: relative path to an icon to display in the footer of the visualizationFOOTER_ICON_TITLE: tooltip to use when the user hovers over the footer icon (can be a translation token)
An example:
class MyVisualization extends Visualization
{
    const ID = 'myvisualization';
    const TEMPLATE_FILE = '@MyPlugin/_myVisualization.twig';
    const FOOTER_ICON = 'plugins/MyPlugin/images/myvisualization.png';
    const FOOTER_ICON_TITLE = 'My Visualization';
}
Adding new display properties
Visualizations can define their own display properties (in addition to what is available in Config) by creating their own Config class. This new class must derive from Config and the visualization must provide an override for the getDefaultConfig() method that creates an instance of this new class. For example:
class MyVisualizationConfig extends Config
{
    public $showMagicWidget = true;
    public $showDisclaimer = false;
}

class MyVisualization extends Visualization
{
    // ...

    public static function getDefaultConfig()
    {
        return new MyVisualizationConfig();
    }
}

class Controller
{
    public function myReport($fetch = false)
    {
        $view = \Piwik\ViewDataTable\Factory::build(
            $defaultType = MyVisualization::ID,
            $apiAction = 'MyPlugin.myReport',
            $controllerMethod = 'MyPlugin.myReport',
        );

        $view->config->showMagicWidget = false;

        return $view->render();
    }
}
Visualizations can also create their own RequestConfig class for properties that affect the request. The process is the same as shown above.
Changing what data is loaded
If needed, custom visualizations can alter what data is loaded by the base ViewDataTable class.
The evolution graph visualization does this to get reports for the last N periods so it can display data over time. The treemap visualization does this to get data for last period so the percent change of each row can be displayed.
To change what data is loaded, visualizations can alter the request using the $request_parameters_to_modify property. This can be done in the Visualization::beforeLoadDataTable() method. For example:
class MyVisualization extends Visualization
{
    // ...

    public function beforeLoadDataTable()
    {
        $date = Common::getRequestVar('date');
        $yesterday = Date::factory($date)->subDay(1)->toString();

        $this->requestConfig->request_parameters_to_modify['date'] = $yesterday;
    }
}
Note: If you change what data is loaded, you may also need to override the Visualization::isThereDataToDisplay() method. Otherwise, the 'no data' message may not appear even if there is no data for the report you are displaying.
Manipulating report data before displaying
Visualizations can modify report data after it is loaded by overriding one of the following methods:
beforeGenericFiltersAreAppliedToLoadedDataTable(): Called byVisualizationafter report data is loaded and after priority filters in the$filtersdisplay property are executed. Called before generic filters are executed.Override this method if you need to use the report's full data (ie, before it has been limited/truncated/sorted/etc.).
afterGenericFiltersAreAppliedToLoadedDataTable(): Called byVisualizationafter report data is loaded, after priority filters are executed and after generic filters are executed.Override this method if you need to use the report data after it has been sorted/filtered/limited/etc., but before presentation filters have been applied.
afterAllFiltersAreApplied(): Called byVisualizationafter all filters (priority, generic and queued) are executed.Override this method if you need to use the report data after it is ready to be displayed.
Report data can also be manipulated by setting the $filters display property.
Making your visualization available everywhere
If you want to allow Matomo users to use your visualization on any report (by clicking the appropriate footer icon), place your visualization class in the Visualizations/ directory of your plugin:
plugins/MyPlugin/Visualizations/MyVisualization.php
Visualizations in this directory are automatically discovered by Matomo and added to the global list of available visualizations. No event subscription is needed.
Visualizations that are exposed this way must have the FOOTER_ICON and FOOTER_ICON_TITLE ViewDataTable metadata set.
Extending ViewDataTable's JavaScript
Unless your visualization is very simple or builds on another visualization (such as the "table" visualization) you will probably need to extend ViewDataTable's client-side logic.
All of ViewDataTable client side logic is encapsulated within the DataTable JavaScript class (located in the dataTable.js file). If you are extending Visualization directly, you should extend DataTable to add your own client-side logic. If you're extending another visualization, you will have to extend that visualization's JavaScript class. For example:
(function ($, require) {

    var exports = require('piwik/UI');

    /**
     * Class that handles UI behavior for the MyVisualization visualization.
     */
    exports.MyVisualization = function (element) {
        exports.DataTable.call(this, element);
    };

    $.extend(exports.MyVisualization.prototype, exports.DataTable.prototype, {
        // ...
    });

}(jQuery, require));
When extending DataTable the only method you are required to override is the init() method. Here, you should place your visualization's initialization code:
$.extend(exports.MyVisualization.prototype, exports.DataTable.prototype, {

    init: function () {
        exports.DataTable.prototype.init.call(this);

        this._bindEventCallbacks(this.$element);
        this._addSeriesPicker(this.$element);

        // ... etc. ...
    }
})
After extending the JavaScript class, you must set it in the $datatable_js_type property of your visualization:
class MyVisualization extends Visualization
{
    // ...

    public function beforeRender()
    {
        $this->config->datatable_js_type = 'MyVisualization';
    }
}
Adding new UI controls
Some visualizations may require custom UI controls. For example, the default graph visualizations add a widget called the series picker to the UI.
New controls can be added one of two ways:
they can be added entirely through JavaScript (as is done with the series picker)
To achieve this, create HTML elements dynamically within your visualization's JavaScript class'
init()method. See the series picker source code for an example.or the HTML for a control can be rendered with a visualization and the visualization's JavaScript class can attach some logic to the HTML
To achieve this, add HTML to your visualization's twig template then bind logic to the HTML in your visualization's JavaScript. See the treemap plugin for an example (the zoom-out button is an extra control).
Styling your visualization
The root <div> of every report visualization will have the dataTable CSS class. They will also have a CSS class based on the visualization used. It will look like dataTableViz* where * is the unnamespaced class name of the visualization (for example dataTableVizHtmlTable).
You can select all report visualizations with the .dataTable CSS selector. You can select report visualizations of a specific type using the visualization specific CSS class, for example, .dataTableVizHtmlTable or .dataTableVizHtmlTable > .dataTableWrapper.
You can also use the $datatable_css_class property to add more CSS classes if you need to. This property can be useful if you need to customize a visualization's appearance, but only for specific reports.
Learn more
- To learn how reports are stored and created, read our Data Model guide.
- To see a full example of creating a new visualization, see the source for the Treemap Visualization plugin.
- To learn more about Matomo Controllers and outputting HTML, read about Controllers in Matomo.
- To learn more about interacting with Matomo's client side JavaScript, read our Working with Matomo's UI guide.